Curium Pharma: a complex chain in view
Diagnoses and treatments of cancer, bone and brain diseases require nuclear tracers. This makes it possible to detect diseases at an early stage: medical isotopes can detect where (cancerous) cells are accumulating. This allows a radiologist to look through a body without the need for a knife. So actually one of the most beautiful things you can do with radioactive substances!
The objective: understanding by all through insight
Curium Pharma is one of the few producers in the world of radioactive tracers. Before these are delivered to a hospital, a huge process is required. This, of course, involves extreme care. Especially for transport, there are – fortunately – lots of checks and protocols. At the same time, the time pressure is critical: it is essential that everything is delivered on time. The stakes are high!
For that reason, Curium wanted to be able to explain and show very well how this works. Because that process is sometimes quite opaque, and radiology lab technicians want to know why it sometimes takes longer to get a package delivered on Monday.
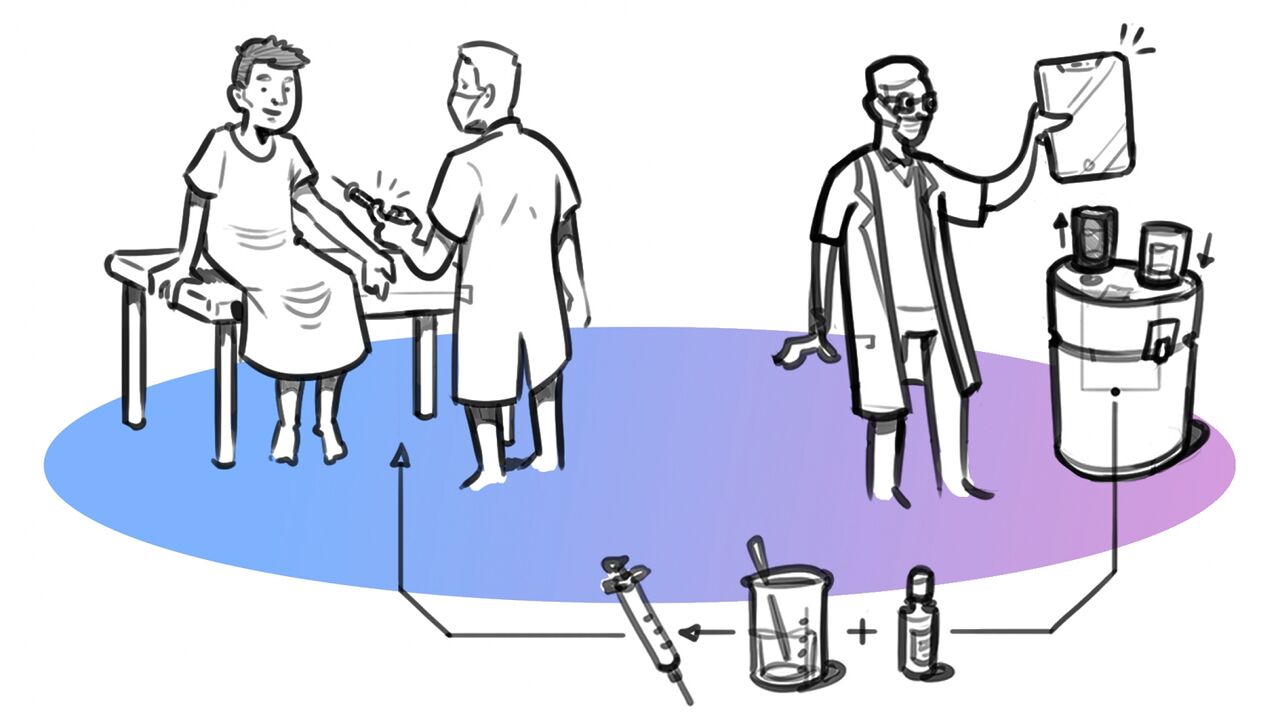
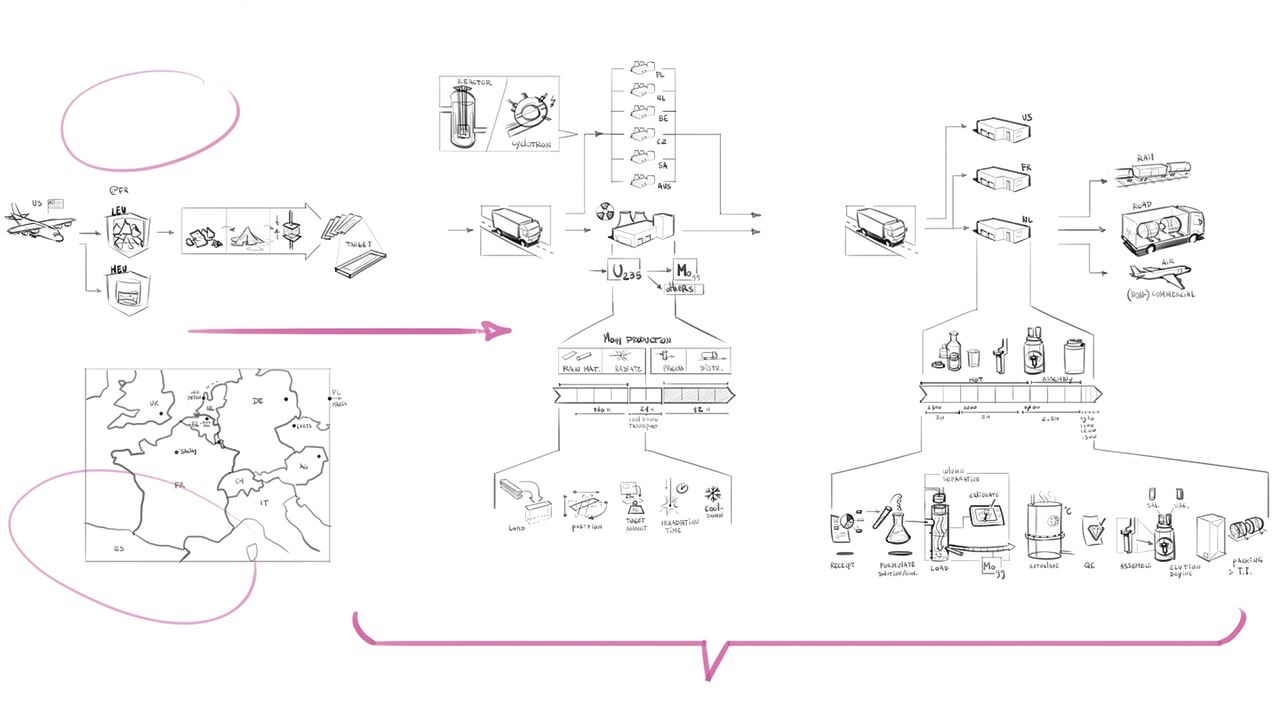
This is what the process looked like
The solution
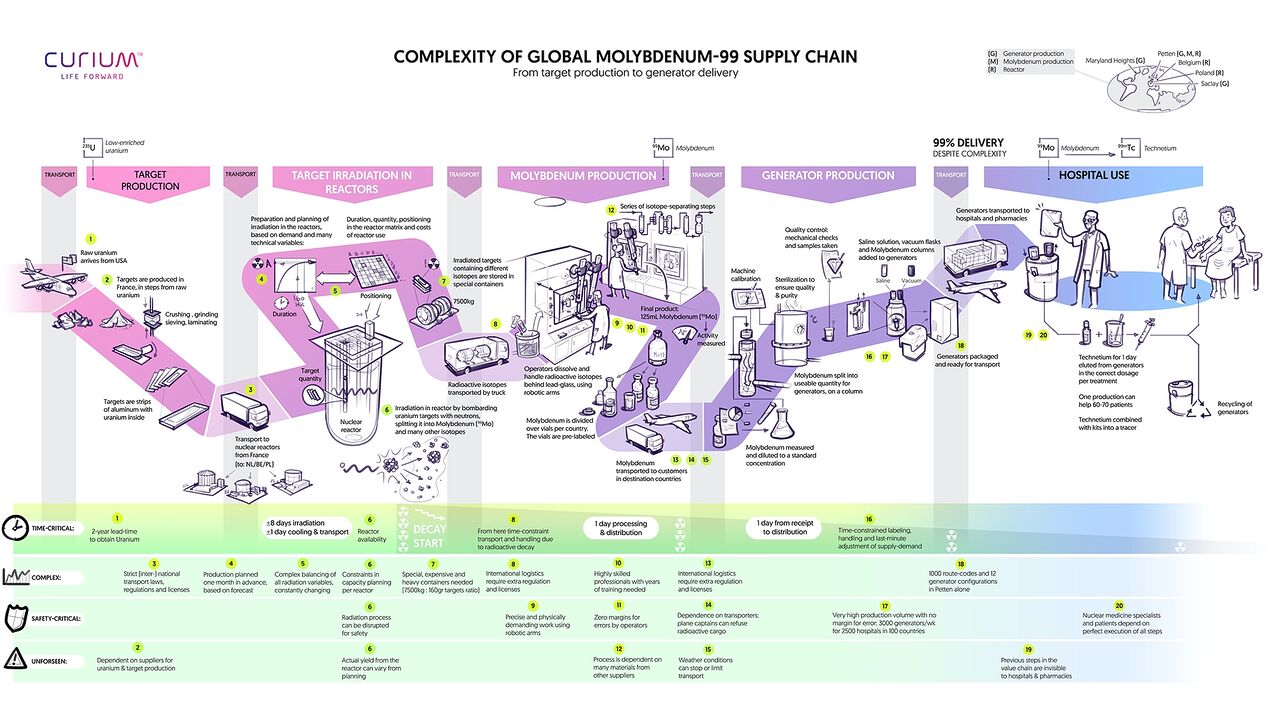
We mapped the entire chain – from raw material to usable product. To inform and, above all, to foster understanding of this complex task.
A supply-chain and value-chain are two processes of great importance to a company. They ensure that good-quality products are delivered to customers in a well-timed manner. This is obviously crucial with such a fragile and life-saving product!
This value chain shows all the activities through which value is generated or added to the product. It actually gives a look behind the scenes of a product, and makes users look with different eyes.
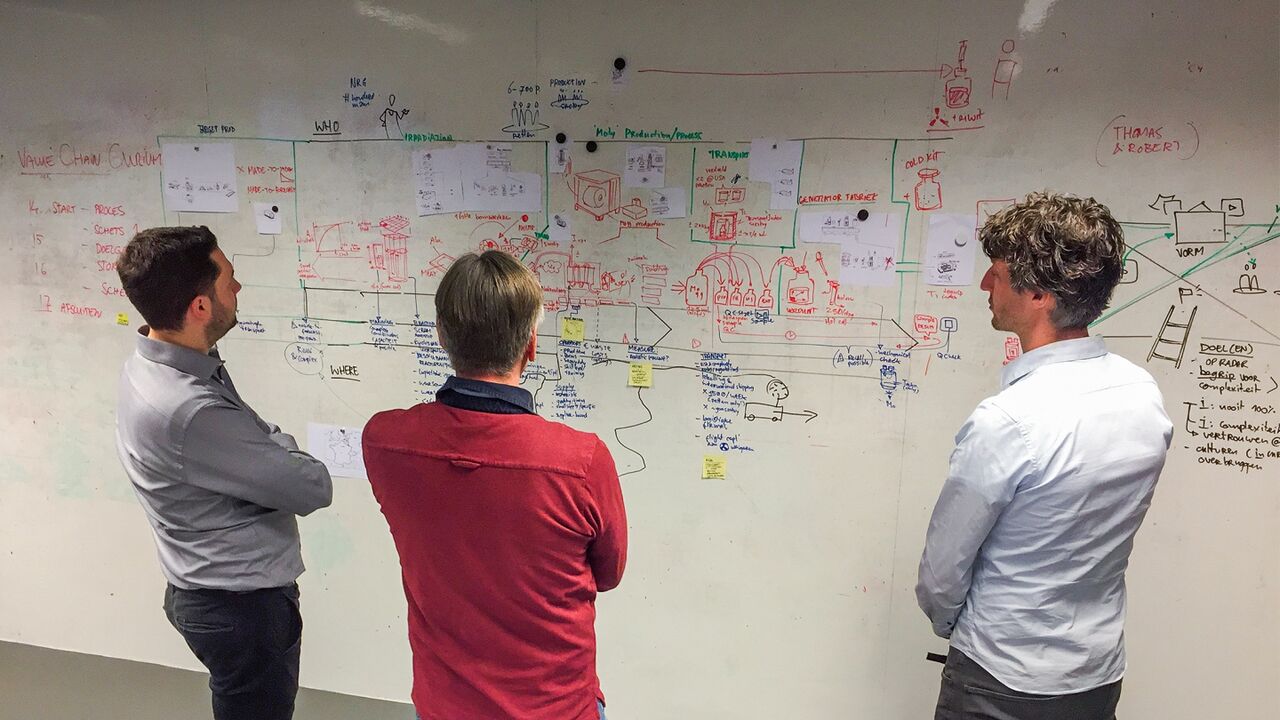
How a drawing helps to structure thoughts
Flatland’s methodology challenges people to formulate very clearly. Professionals often suffer from ‘the curse of knowledge’: once you know something (in this case, everything about isotopes and nuclear chains), it is hard to imagine that someone else does not have that knowledge. Drawing acts as a mirror of your thoughts: a drawing starts asking you questions. By seeing it, you can fill in the gaps in the drawing (sometimes literally a blank space on the whiteboard) as well as each other’s thoughts.
When visualising, you encounter all kinds of things: are these parties on the same level? Is the order correct? Which information is more or less important? Or: where does the decrease in radioactivity start? You can put many layers of information.
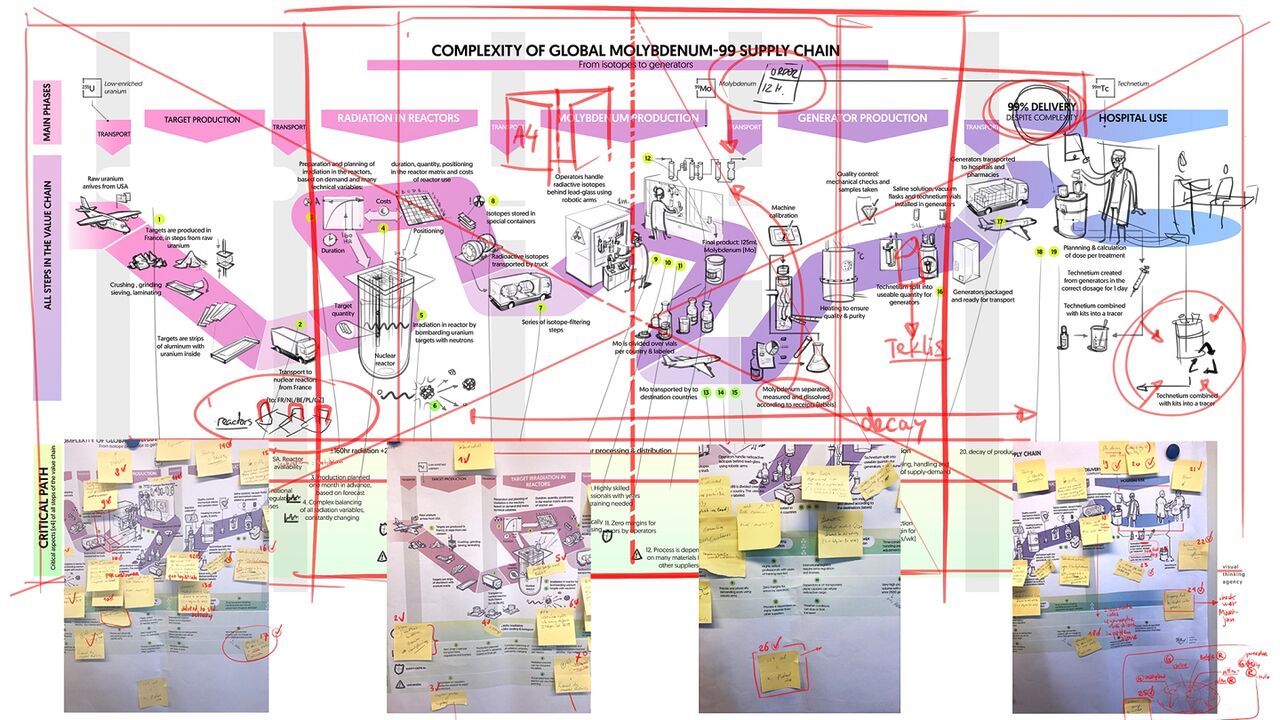
The result
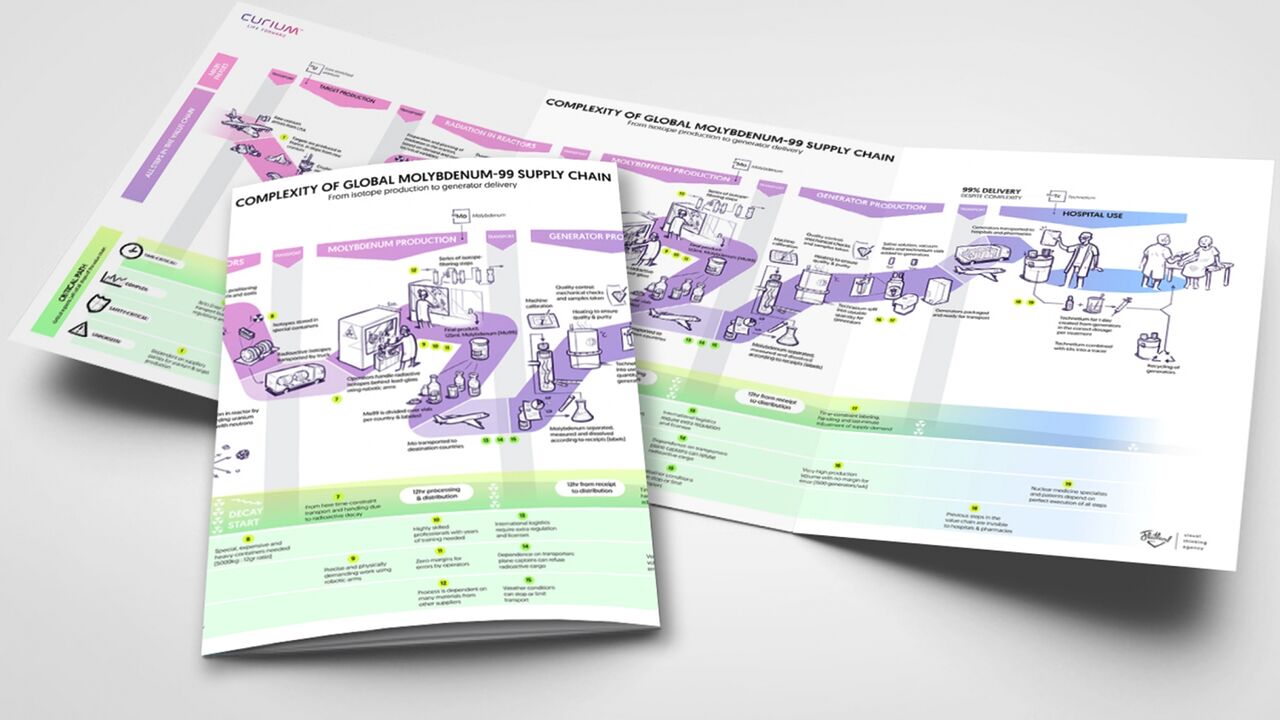
The result
We deliberately did not make the route a straight line, to emphasise that there are so many complex steps. Because we organised the information differently, Curium recognised that they actually had a clear, consistent storyline. We also added colour coding: in pink the production process, in purple the logistical lines. And it proved important to clarify where all risks are located, so we added separately at the bottom – in green – the critical path.
Use of visualisation
The value chain visualisation was received with enthusiasm. Curium could now show what they all do, and make it clear what the value of the company actually is. They could now start selling themselves, rather than the final product. For external use, this is powerful, to give insight and understanding to customers. But it also delivers a lot internally: a consistent storyline and a clear message.
How can we support you?
Also working on work processes and chain collaborations? Send us an e-mail!
ContactVisual Strategist